

Key Takeaways
- OEE equals Availability × Performance × Quality; it is a diagnostic measure, not a universal scorecard.
- The familiar 85% “world-class” figure is a historical reference point, not a fair target for every line or industry.
- Publicly available sector figures differ in method and population. Use them as directional context, not as verified Indian medians.
- Before setting a target, standardise planned production time, ideal cycle time, quality definition, and loss coding across shifts and sites.
What “good” looks like depends on the process, the denominator, and the quality of the data behind the number.

What OEE measures

Overall Equipment Effectiveness combines three factors. Availability is the share of planned production time during which equipment runs. Performance compares actual output speed with the ideal rate. Quality is the share of output that meets requirements first time. Multiply the three percentages to get OEE.
For example, a line with 85% availability, 90% performance, and 98% quality has OEE of about 75%. That composite number is useful only if the underlying definitions are consistent. If one plant excludes changeovers from planned time and another counts them, comparing their results creates false confidence.
Why one target does not fit every Indian factory
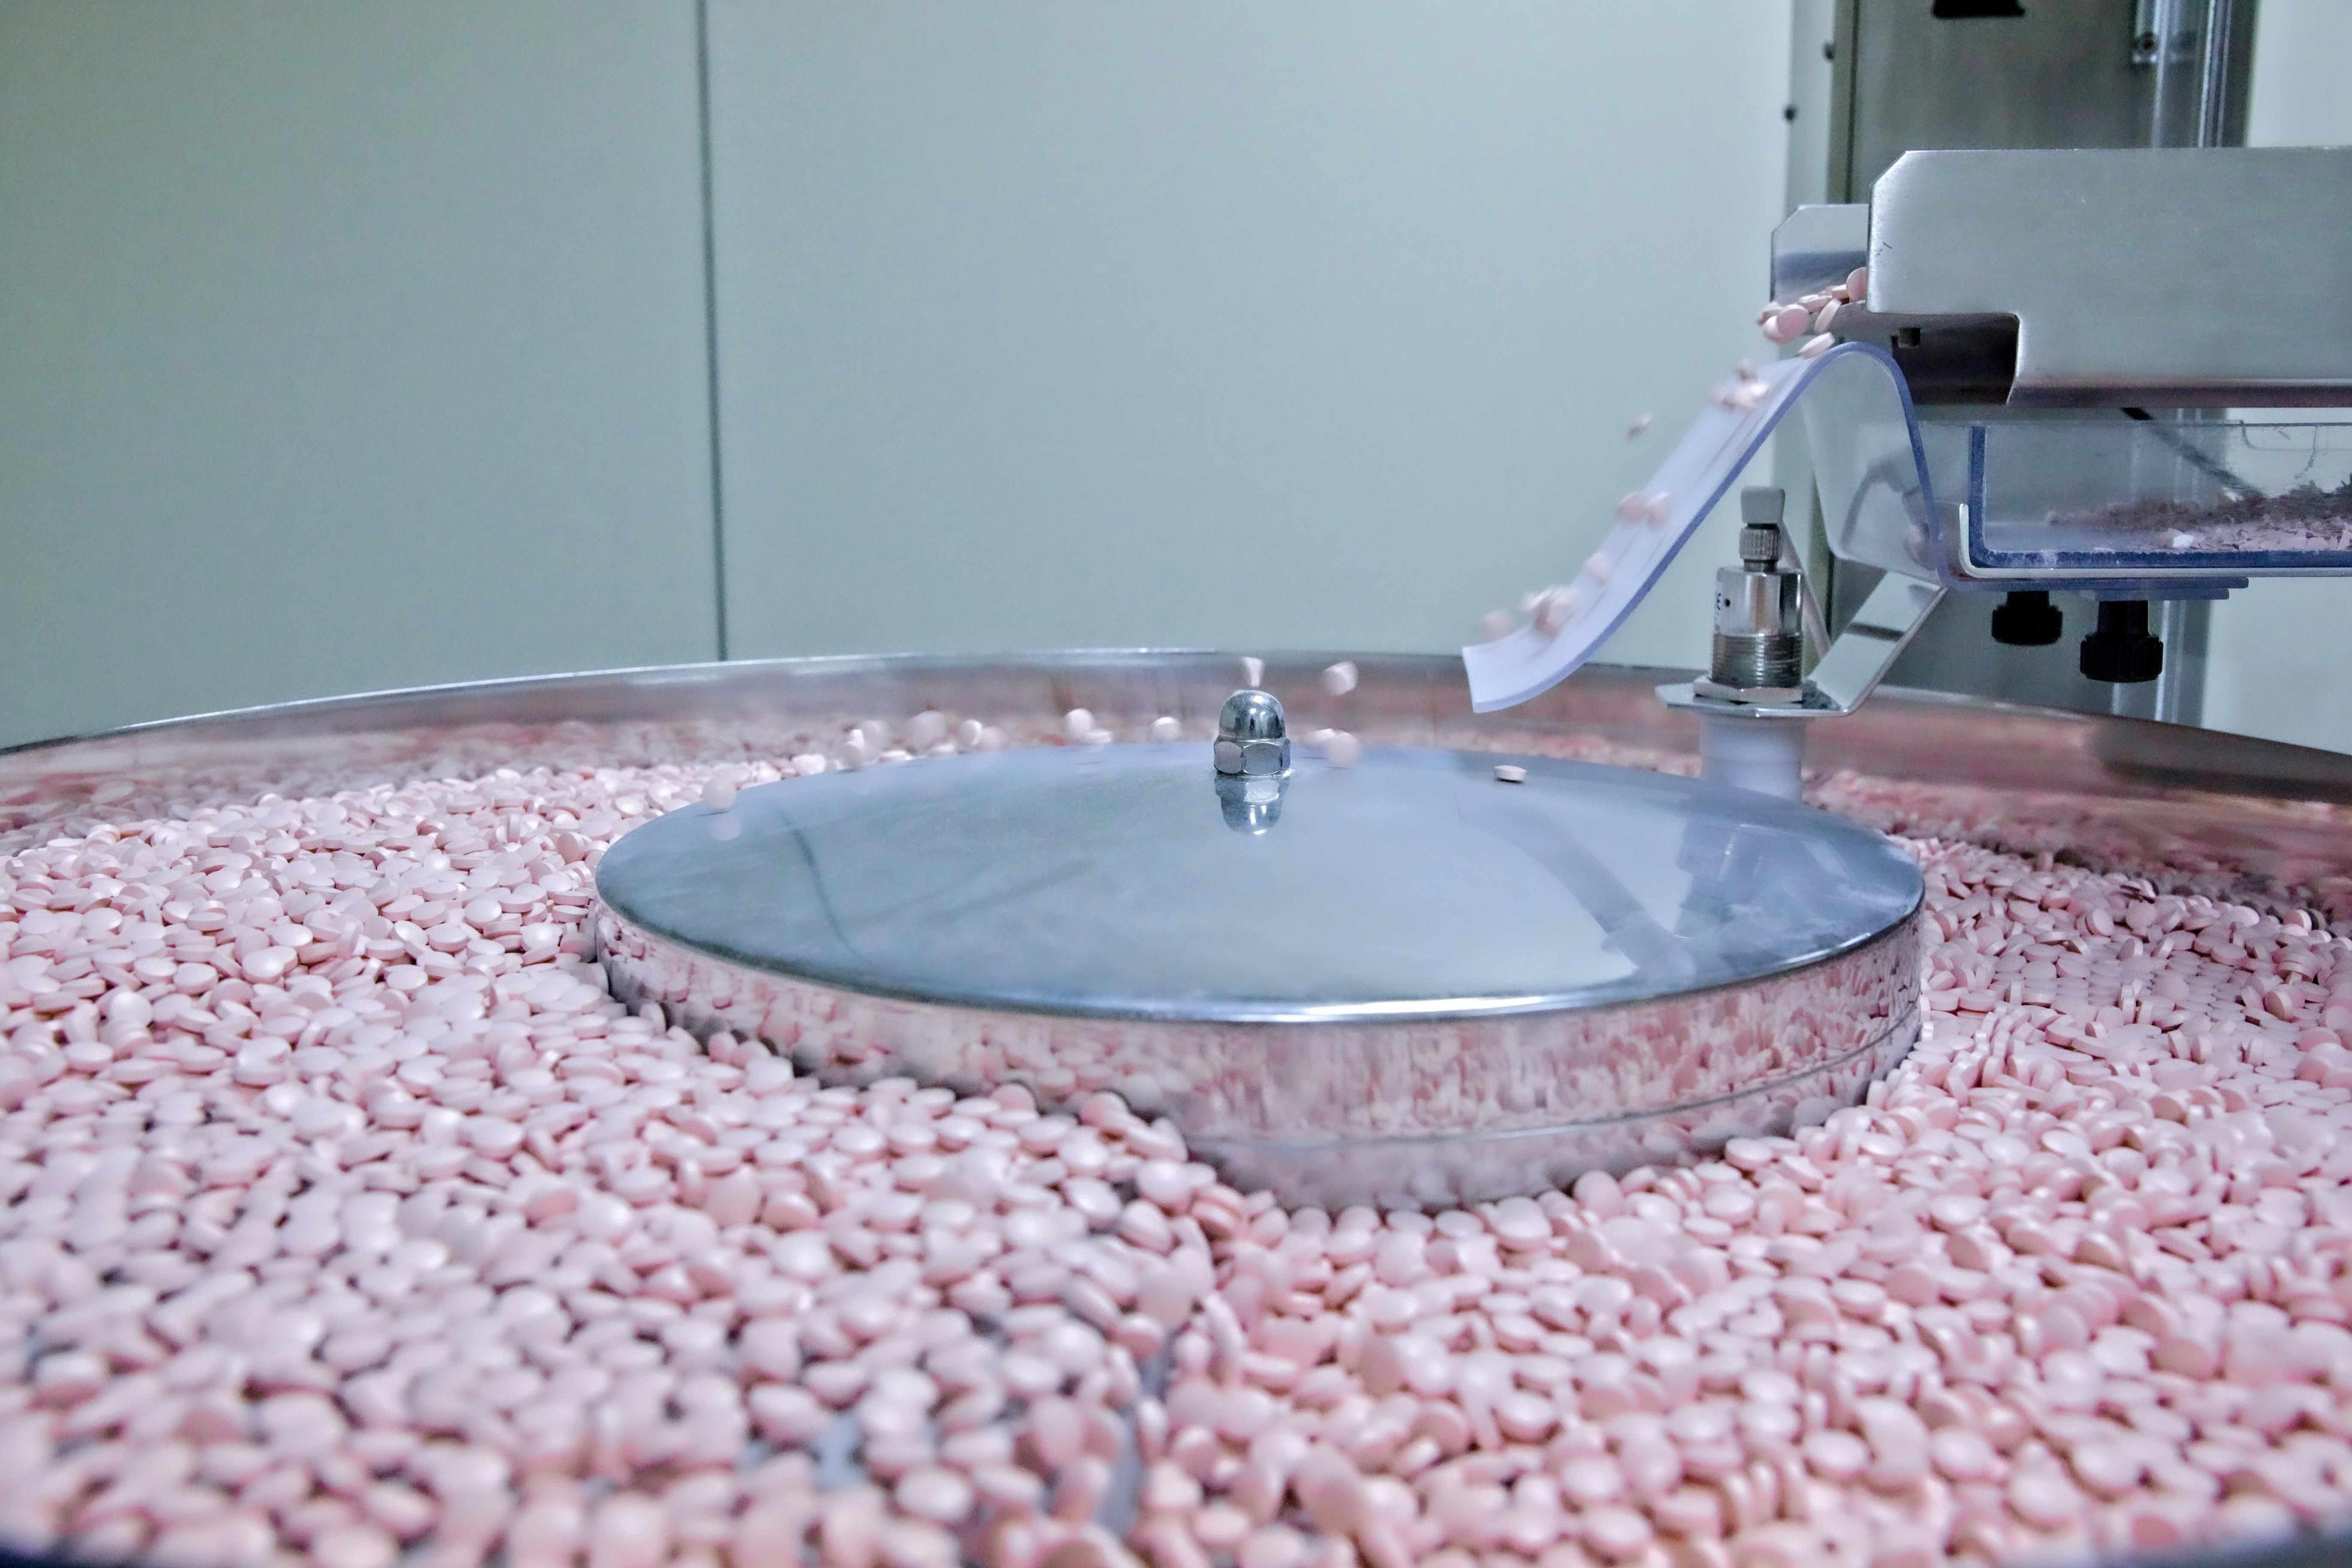
A high-volume automotive assembly line, a batch pharmaceutical process, and a job-shop CNC cell have different operating patterns. Cleaning, product changeover, validation, batch release, and low-volume scheduling affect the time available to produce. A single target may reward the wrong behaviour or conceal the constraint that matters.
The right question is often not “Are we at 85%?” but “Which loss is most controllable in this process, and is it getting better under a stable measurement method?”
A cautious 2026 sector comparison
The table below gives broad planning bands synthesized from publicly available 2026 benchmark pages and operational context. They are indicative comparison ranges, not audited India-wide averages or an official standard. Published sources do not consistently define sample sizes, time windows, planned-time rules, or whether values represent medians, top quartiles, or world-class targets. Validate locally before adopting a goal.
Indicative sector bands
| Automotive discrete lines: | ~60–85% observed range is cited by some benchmark sources; 85%+ is often treated as an ambitious reference for mature, stable lines. |
| Food and beverage: | ~55–80% is a broad planning range; sanitation, allergen changeover, product mix, and seasonal runs matter. |
| Pharmaceutical: | ~40–70% is sometimes reported for production equipment; cleaning, batch release, and validation can make simple comparisons misleading. |
| Textile: | ~45–75% is a broad directional range; loom type, yarn/fabric mix, and stoppage conventions strongly affect the result. |
| Metal fabrication / job shop: | ~50–78% appears in some cross-industry guidance; high mix, low volume, and setup time dominate many cells. |
| Electronics / SMT: | ~65–88% appears in some 2026 sector tables; line balance, changeover discipline, and component availability shape performance. |
How to use a benchmark without misusing it
Compare like with like: same process family, similar product mix, similar shift pattern, and comparable OEE rules. Prefer a measured baseline at your own plant to a number from a vendor blog. If external data are available, check the original report for sample size, geography, period, and metric definition.
Use the sector band to start a conversation, not to set individual operator targets. Then decompose OEE: if availability is low, investigate downtime and planned stops; if performance is low, check cycle assumptions and minor stops; if quality is low, separate scrap, rework, and start-up losses.
Build a reliable baseline

- Define the clock: Agree which scheduled minutes count as planned production time and how breaks, cleaning, changeovers, and planned maintenance are treated.
- Validate the ideal rate: Use an achievable, documented ideal cycle time for each product or recipe. A stale theoretical speed makes performance meaningless.
- Capture losses close to the event: Automated machine states reduce recall delay, but operators still add context. Keep reason codes short, understandable, and reviewed.
- Separate good output from total output: Use the same first-pass quality rule across shifts and products.
- Review distributions: Look at line-by-line and shift-by-shift ranges, not just a plant average that hides bottlenecks.
Turning an OEE number into action
Suppose a plant reports 63% OEE. The next step is not to announce a target of 85%. Split the result into A, P, and Q; identify the largest repeatable loss; check it against maintenance and quality records; and run a focused improvement. A measured reduction in setup time or recurring minor stops is more actionable than a round-number aspiration.
Perimattic says its OEE Monitoring module captures machine data, tracks production against target, and generates shift reports. Its product page also cites typical improvement figures; treat those as vendor-reported claims rather than a promise. A pilot should establish your own baseline and agreed measurement rules.
Conclusion
A useful benchmark helps a team ask better questions. It does not decide what a specific Indian plant should achieve. Establish a trustworthy local baseline, compare against genuinely similar operations, and work on the loss that constrains throughput or quality.
See Intellyx OEE & Production Monitoring for product details and data-collection options.
Sources and further reading
- Intellyx OEE Monitoring | https://perimattic.com/products/perimattic-intellyx/oee-monitoring/
- TeepTrak: India manufacturing OEE benchmark page (2026) | https://teeptrak.com/en/oee-benchmark-india-manufacturing-sector-2026/
- TeepTrak: sector benchmark page (2026) | https://teeptrak.com/en/oee-benchmark-by-industry-2026/
- 2025 Productivity Benchmark Report (sponsored report; methodology should be reviewed) | https://marketing.foodindustryexecutive.com/hubfs/Sponsored%20Resources/2025%20Redzone%20Productivity%20Benchmark%20Report.pdf