
Capability · LLM observability
LLM observability and cost tracking
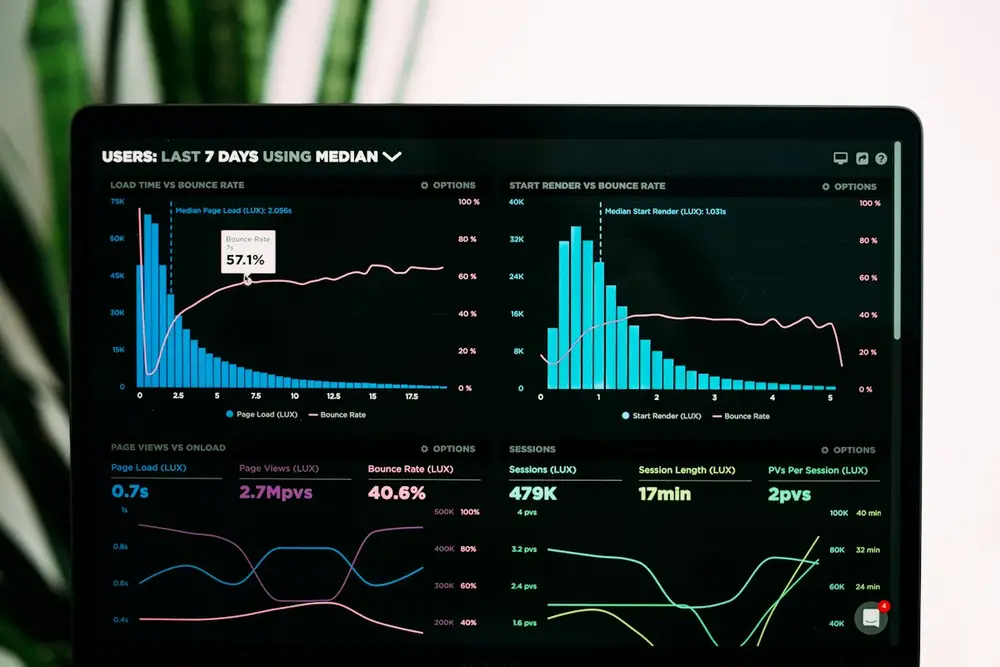
Every model call in production, with its latency, tokens, cost and quality score, traced on OpenTelemetry. Find out why an answer was slow, wrong or expensive from production data instead of trying to reproduce it.
Last reviewed by the Perimattic AI Suite team
In short
What is LLM observability?
LLM observability is the practice of tracing, measuring and evaluating large language model calls in production. Each call is recorded with its prompt and output (redacted where needed), model and version, latency, token counts, cost and quality scores, so teams can debug failures, control spend and show how the system behaves. It is the base layer of the wider practice of AI observability.
Monitoring tells you that; observability tells you why
A latency chart shows a spike. A trace shows it came from one retriever, for one tenant, after one prompt change.
Provider-neutral by design
OpenTelemetry GenAI conventions describe OpenAI, Anthropic, Bedrock, Azure, Vertex and other providers in the same attributes, so one dashboard covers them all.
Capabilities
What LLM observability measures
Traces for every call
Model, provider, version, parameters, finish reason and timing, linked to the request that triggered it.
Signal it produces: Request-level trace
Latency breakdown
Time to first token, total latency and p50, p95 and p99 by model, route and tenant.
Signal it produces: p95 latency per span
Token and cost tracking
Input, output and cached tokens priced per model, then attributed to agents, features, teams and users.
Signal it produces: Cost per user, per feature, budget alerts
Quality scores
Faithfulness, relevance and hallucination checks on live traffic, not just on a test set.
Signal it produces: Hallucination rate over time
Redacted prompt and output logs
Inputs and outputs kept for debugging, with personal data removed in the collector by rules agreed with your privacy team.
Signal it produces: Searchable, redacted logs
Alerts
Thresholds on errors, latency, spend and quality, sent to the channels your on-call team already uses.
Signal it produces: Alert history
Cost tracking
Where LLM spend actually goes
Provider invoices show totals per model. They don’t show which feature, team or customer drove the bill. Cost attribution starts from the token counts on each span and adds the context only your application knows.
To size spend before you build, try the LLM cost calculator. It now estimates cost per user and per agent as well as per request.
Count tokens per call
Input, output and cached tokens from gen_ai.usage.* attributes on every span.
Price them
Apply each model’s current per-token price, kept up to date as providers change rates.
Attribute
Roll costs up by agent, feature, team and end user using attributes you add once.
Act
Set budgets and alerts, and spot the prompts or users that cost the most.
Choosing a tool
LLM observability tools compared
The main options all accept OpenTelemetry today, so the choice comes down to deployment, workflow and what you need to prove. Each comparison below is checked against the vendor’s own documentation and dated.
Read Perimattic vs Langfuse, Perimattic vs LangSmith or Perimattic vs Datadog for the details, or compare running costs with the LLM observability cost calculator.
| Tool | Best fit | Detailed comparison |
|---|---|---|
| Langfuse | Open-source (MIT core), self-hostable tracing with prompt management | Perimattic vs Langfuse |
| LangSmith | Teams building on LangChain or LangGraph | Perimattic vs LangSmith |
| Datadog Agent Observability | Teams standardised on Datadog for APM and infrastructure | Perimattic vs Datadog |
| Perimattic AI Suite | Regulated teams that need telemetry turned into audit evidence | Platform overview |
Getting started
Send your first LLM trace
If your services already use OpenTelemetry, you only change where the exporter points. The OpenTelemetry GenAI instrumentation generator writes the setup code for your language and provider.
export OTEL_EXPORTER_OTLP_ENDPOINT="<your-perimattic-otlp-endpoint>"
export OTEL_EXPORTER_OTLP_HEADERS="authorization=Bearer $AI_SUITE_KEY"
export OTEL_SERVICE_NAME="support-assistant"
Illustrative. Your endpoint and key are issued during early-access onboarding.
FAQ
Common questions
Short answers to the questions engineering and platform teams ask most often.
How does LLM observability work with OpenTelemetry?
You add the OpenTelemetry SDK, or an instrumentation library for your LLM client, to the application. Each model call becomes a span with standard gen_ai.* attributes such as the provider, model and token usage. The OTLP exporter sends spans to your backend, which can be Perimattic AI Suite, Langfuse, LangSmith, Datadog or several at once.
What is the difference between LLM observability and AI observability?
LLM observability covers individual model calls. AI observability is the wider practice that adds agent orchestration, retrieval pipelines, tool calls, evaluation and governance. LLM observability is where most teams start.
Which LLM providers can be traced?
Any provider whose client calls emit OpenTelemetry GenAI spans, natively or through an instrumentation library. The conventions list OpenAI, Anthropic, AWS Bedrock, Azure AI, Google Vertex AI and Gemini, Mistral, Cohere and others as well-known provider names.
Does tracing slow down LLM calls?
OpenTelemetry exports spans asynchronously and in batches, so the request path isn’t blocked waiting for the backend. The model call itself usually takes far longer than recording it. At high volume, storage is the main cost, which sampling and retention policies control.
How do I track LLM cost per user?
Add a user or tenant identifier to your spans (hashed if it is personal data). The backend multiplies token counts by model prices and groups the result by that attribute. The LLM cost calculator shows the arithmetic for your own usage pattern.
Go further
Related tools, guides and services
- Free toolLLM cost calculatorEstimate token cost per request, per user and per agent across current models.Open
- Free toolOpenTelemetry GenAI instrumentation generatorGenerate OTel setup code for your language, provider and exporter.Open
- ArticleHow to monitor hallucinations and drift in productionThe signals that tell you an LLM is degrading, and what to do about them.Open
- ServiceLLM fine-tuning servicesPerimattic fine-tunes models for your domain, then helps you monitor them in production.Open
- Case studyAI chatbot for a major real estate companyAn LLM chatbot Perimattic built and runs in production.Open
- White papersGenerative AI white papersResearch on putting generative AI into production.Open
See what your AI systems are doing, with evidence to back it up
Perimattic AI Suite is in early access. Tell us what you are building and a Perimattic engineer will follow up to scope your first instrumented system.
Prefer email? sales@perimattic.com