
Every size, color and collection, watched like a business, not a spreadsheet
Brandnata for apparel and fashion brands is an analytics and AI agent platform that tracks sales, returns and stock by size, color and collection, and reconciles them with your ad spend and marketplace sales.
Brandnata connects your storefront, ad accounts, marketplaces and inventory into one view built for how fashion actually sells: by variant, by season, by collection, not just by SKU count.
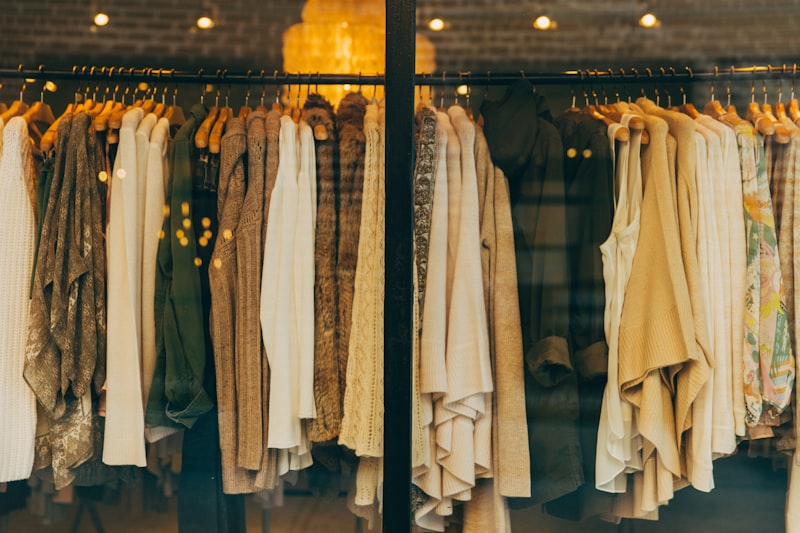
Fashion's numbers hide in variants, not totals
Generic ecommerce dashboards stop at the product level. Apparel and fashion brands lose margin in the layer underneath: the specific size, color and collection that generic tools flatten into one aggregate number.
Return spikes buried by size and color
A 22% return rate looks like one number until you realize it's a single size running small on one SKU, not a brand-wide problem. Most tools can't get that granular.
Seasonal collections that miss their window
Winter stock arriving after the cold snap, or spring drops launching into a heatwave, demand signals exist, they're just scattered across too many dashboards to act on in time.
Ad spend that ignores true product margin
ROAS looks healthy on a campaign level while the actual bestselling SKU it's driving is barely profitable after markdowns, fulfillment and return costs.
Dead stock discovered too late
By the time slow-moving inventory shows up in a quarterly review, markdown season has already eaten the margin you could have protected weeks earlier.
Built for how fashion actually sells
Four capabilities apparel and fashion brands rely on most, reconciled from your storefront, ad accounts and inventory in one place.
Size & color-level performance
See which specific variants are selling, returning, or sitting dead, not just which product line.
Product-level profitability
Net margin per SKU after ad spend, marketplace fees, returns and shipping, not gross revenue.
Campaign-to-collection attribution
Know exactly which Meta and Google campaigns are driving sales for which collection.
Repeat purchase & wardrobe tracking
See which first purchases lead to a second order, and how long that usually takes.
ROAS that accounts for returns and markdowns
A campaign can look profitable on paper while the product it's driving sees 30%+ returns. Brandnata calculates ROAS and CAC against net revenue, after returns, so the number you see is the number that's actually true.
- Meta and Google spend matched to real, return-adjusted orders
- Campaign performance broken down by collection and season
- Creative fatigue flagged before it burns spend on a dying ad
Heads up:“Summer Linen” campaign ROAS drops to 1.8x after factoring in its 27% return rate.
Down to the size and color, not just the SKU
A live read on every variant's sell-through, return rate and stock position, so you catch a sizing problem or a dead-stock risk while it's still fixable.

Know who buys again, and why
Fashion revenue depends on repeat purchases and full-price sell-through, not just first-order volume. Brandnata tracks the behavior that predicts both.
See the split by collection, and which drops bring back existing customers versus only new ones.
Track how much of your revenue relies on promo codes, and whether that's rising quarter over quarter.
Compare lifetime value of customers acquired via Meta, Google, organic and marketplaces.
Understand which categories customers buy together, tops with bottoms, accessories with outerwear.
Your stack, already supported
Most apparel and fashion brands run on the same core stack, and each connects through OAuth or read-only API access in minutes. See the full integrations directory for the rest.
From anomaly to fix, automatically drafted
Every insight comes with a specific, actionable next step, not just a chart to interpret yourself.
Size-guide fix, suggested automatically
Return rate on one size crosses your threshold
The listing's size guide is flagged with the specific size at fault, and copy edits are suggested before the next campaign scales.
Markdown timing, before it's too late
A SKU shows declining sell-through for 10+ days
A markdown or bundle recommendation lands with the exact discount depth needed to clear stock before it becomes dead weight.

Ad budget shift to the profitable SKU
A campaign's featured product goes margin-negative after returns
Budget is suggested to shift toward the collection's actual best-margin piece, not just its best-selling one.
Built for teams who live in variants and seasons
Apparel and fashion brands come in different shapes, here's how each one uses Brandnata day to day.
DTC apparel brands running their own ads
You're managing Meta and Google spend yourself and need to know which collection, not just which campaign, is actually profitable after returns.
Multi-brand fashion houses
You run several labels or sub-brands through one Shopify or marketplace setup and need size/color visibility per brand, not blended across all of them.
Seasonal and drop-based sellers
Your inventory and demand curve move in sharp seasonal or drop cycles, and a few days' delay in a restock or markdown call costs real margin.
Where variant-level tracking actually comes from
Other ways fashion brands currently piece this together, and where each one runs out of granularity.
| Approach | Coverage | Where it falls short |
|---|---|---|
| Brandnata for Apparel & Fashion · this page | Size, color and collection-level tracking, reconciled against ad spend and returns, with fixes suggested automatically | N/A |
| Generic ecommerce dashboard | Product-level sales and traffic totals across your storefront | Flattens every size and color into one SKU number, so a sizing problem hides inside a healthy-looking total |
| Spreadsheet reconciliation | Manually exported orders, returns and ad spend, stitched together by hand | Takes days per season to rebuild, and is already stale by the time markdown decisions need to be made |
| Native ad platform reporting | Meta or Google's own ROAS and conversion numbers | Reports attribution before returns are processed, so a high-return SKU still looks profitable |
What changes for apparel & fashion brands
What variant-level tracking and automated workflows are built to change over a full season.
Frequently Asked Questions
How is this different from Shopify's own analytics?
Shopify Analytics stops at the product level and doesn't include your ad spend or marketplace data. Brandnata reconciles Shopify orders against Meta and Google spend, returns, and marketplace fees, then breaks all of it down to the size, color and collection, not just the product.
Do I need a developer to set this up?
No. Every connection (Shopify, WooCommerce, Meta Ads, Google Ads and more) uses OAuth or read-only API access and takes a few minutes each. Most apparel brands are seeing their first size and color-level insights within a day of connecting their store.
Can it catch a sizing problem before it shows up in returns?
It catches sizing problems as soon as the return rate on a specific size starts climbing, typically days before the pattern would be obvious in a weekly or monthly report, and flags the exact SKU and size at fault.
Does it work with multiple marketplaces, not just Shopify?
Yes. Alongside your storefront, Brandnata connects to Amazon, Myntra, Nykaa, Flipkart and other marketplaces and ad platforms, 80+ integrations in total. See the full integrations directory for the complete list.
How does it handle seasonal collections and drops?
Seasonal SKUs are tracked against their own sell-through curve rather than a flat historical average, so a slow start to a new drop isn't confused with a genuinely underperforming collection, and restock or markdown timing accounts for the season's actual demand window.
Will it change my ad campaigns or pricing automatically?
Not unless you want it to. Every recommendation starts in suggest mode: you see the specific fix (a size guide edit, a markdown depth, a budget shift) and approve it. You can later grant limited, revocable automation for specific actions once you trust the suggestions.
See your collections at variant-level clarity
Connect your storefront and ad accounts, see your first size, color and collection insights within a day.